
When your inbox is quiet, sending more emails can feel like the obvious next move.
You have a list of businesses that fit your buy box. The campaign is running. Surely more outreach will produce more conversations.
Maybe. But before you turn up the volume, it helps to know what the outreach you’ve already done is telling you.
Are certain kinds of businesses responding? Are some locations producing more interest than others? Are the replies coming from owners you would actually want to keep talking to?
Those answers can change where you put your next week of sourcing effort.
DealBuff’s market matrix, built from our own outreach, looks at 124,178 prospects emailed for our clients, broken out by industry and location. The October 2026 update offers a useful reminder: even within the same industry, the response can look very different from one market to another.
Your Buy Box Gets You Started
“I want to buy a manufacturing business” gives your search a direction. Adding geography, size, and business model makes it more useful.
But those criteria don’t tell you which owners will respond to your approach. You learn that by reaching out, reading the replies, and paying attention to the patterns.
Here is one example from the matrix:
| Manufacturing outreach | Prospects contacted | Responses flagged as interested |
|---|---|---|
| Utah | 455 | 3.7% |
| Arizona | 493 | 2.6% |
| Florida | 953 | 2.2% |
| Texas | 1,555 | 0.6% |
The percentages show AI-flagged interest as a share of prospects contacted. Each response still needs a person to review it.
Manufacturing’s overall figure was 1.3%. Looking only at that average would hide the differences above.
If these markets fit your acquisition goals, it’s useful information. It gives you something specific to investigate before you build the next list.
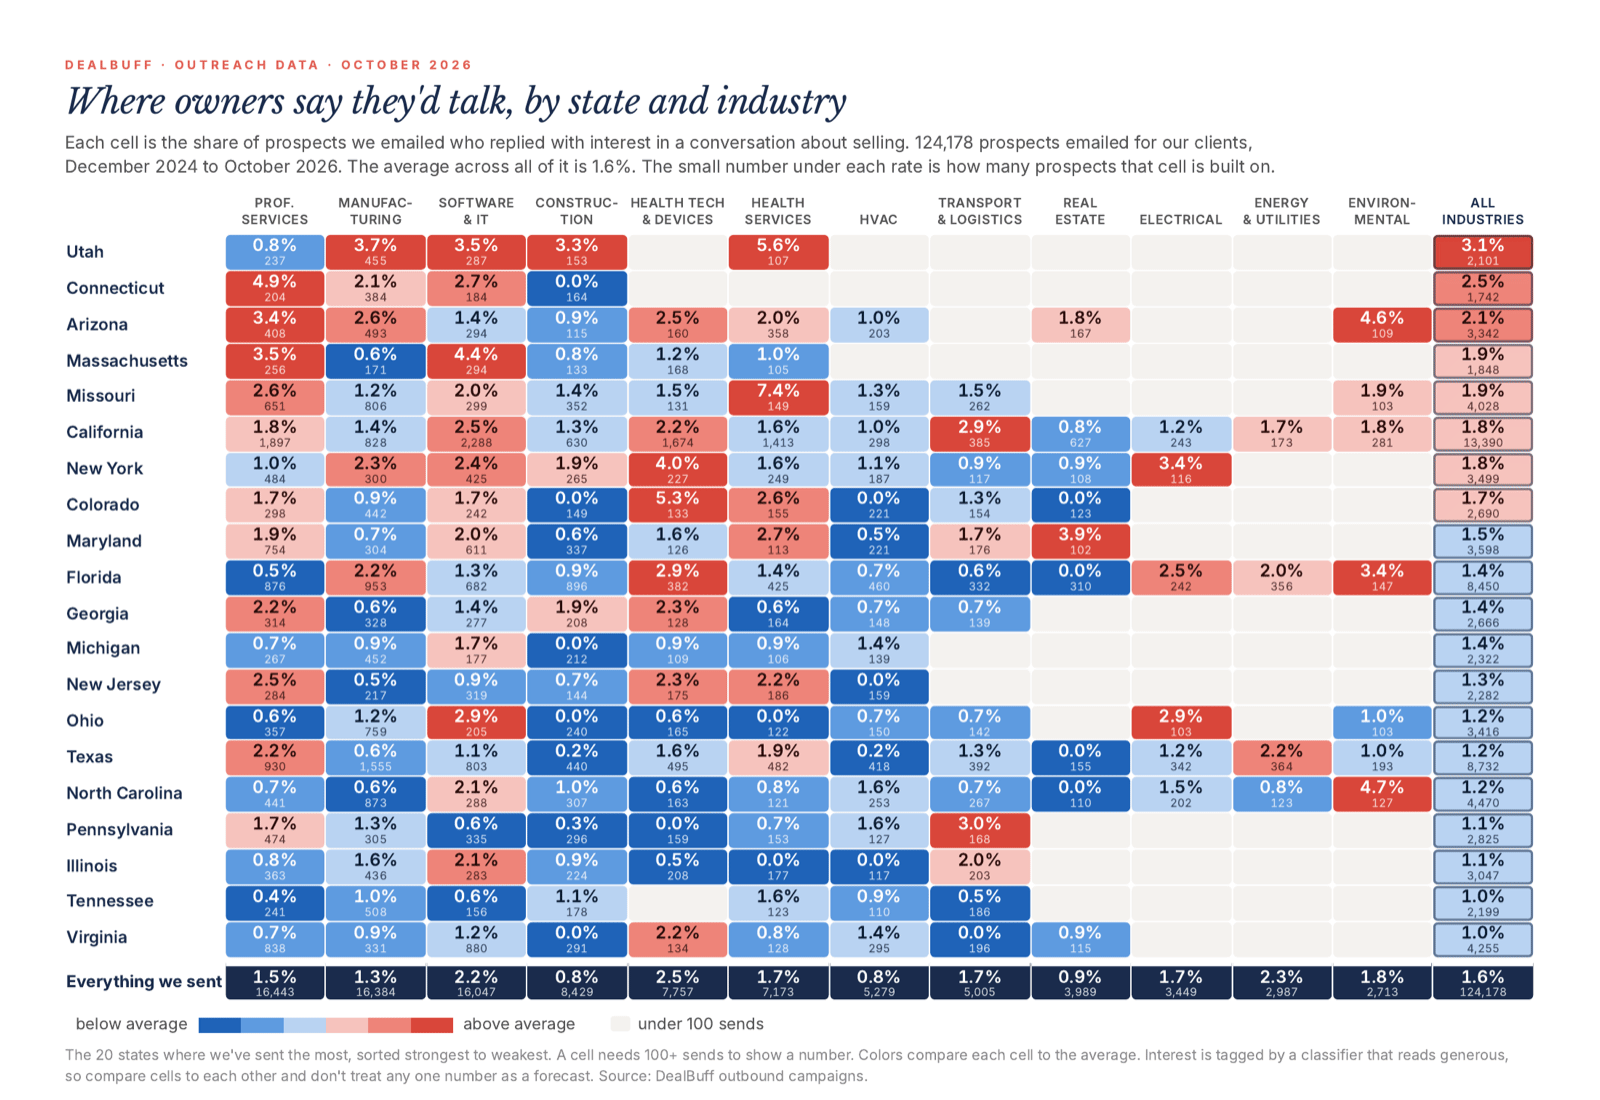
See the full market matrix
A look at our own outreach data: the 20 states where we send the most, across 12 industries, with the number of sends behind every cell. Find the markets worth a closer look before you build your next list.
Download the MatrixA Bigger List Can Keep You Busy
Texas manufacturing had more than three times the outreach volume of Utah manufacturing in this data. It also had a lower share of responses flagged as interested.
That’s a reason to look closer at the campaigns. Were the companies a good fit? Did the message explain why the buyer was interested? Were the contacts accurate? Was the timing different?
The matrix can’t tell us which of those factors drove the results. It can tell us where to start asking questions.
This is where a search can get expensive in ways that never show up on a software invoice.
Every weak-fit company takes time to research. Every campaign needs attention. Every reply needs someone to decide whether it deserves another conversation.
If you keep measuring progress by how many businesses you contacted, you can stay busy for weeks without getting much clearer about where to focus.
An Interested Reply Is the Start of the Work
An owner replying “tell me more” is encouraging. It’s also very different from an owner who has thought seriously about selling and wants to discuss a transition.
Both may be worth a conversation. They need different follow-up.
Before treating a reply as an opportunity, you still need to understand the business, the owner’s expectations, and whether there is a realistic fit with what you want to buy.
That’s why the percentages in this analysis need context. The interest labels come from an AI classifier that can overstate interest. They help compare outreach results; they don’t tell you how many acquisition opportunities you have.
The useful next step is to open the replies and read them.
A Strong Percentage Deserves a Second Look
Missouri health services showed 7.4% flagged interest across 149 contacts. Colorado health tech and devices showed 5.3% across 133.
Those results are worth investigating. The contact counts matter, too.
With a smaller group, a handful of responses can move the percentage substantially. Before changing your search around one promising number, review the companies and replies, then test whether the pattern continues.
You should apply the same judgment to a segment that produced no flagged interest. One quiet campaign doesn’t decide whether a market belongs in your search.
Your goal is to learn enough to make the next decision better.
Put What You Learn Into the Next Campaign
Start with your acquisition goals. A responsive market is only useful if it contains businesses you would want to own and could realistically acquire.
Then look at the outreach in smaller groups. Which industries and locations are getting responses? Where is the interest coming from? Which replies are leading to worthwhile conversations?
Use those answers to decide what happens next. You might research more companies in a promising segment, tighten the criteria on a weak list, or rewrite a message that’s not connecting with owners.
Keep following the conversations after the initial reply. The matrix doesn’t measure qualified opportunities or completed acquisitions. Your search needs to track what happens beyond the inbox.
Make the Search Worth Your Time
This is part of the work behind a sourcing operation: understanding what the market is telling you and deciding what to do about it.
Software can help you find companies and send outreach. Someone still has to review the fit, interpret the replies, and adjust the approach.
At DealBuff, we help buyers connect those steps so the search stays focused on businesses that fit their acquisition goals.
You’re putting real time into finding a business to buy. Each campaign should leave you with a clearer idea of where to spend that time next.
Want help turning your buy box into a focused sourcing process?
About the data: DealBuff Market Matrix, October 2026. Covers 124,178 prospects emailed for DealBuff clients from December 2024 to October 2026, with an overall interest rate of 1.6%. Interest is tagged by a classifier that reads generous, so compare segments to each other and don’t treat any one number as a forecast. Segments with fewer than 100 sends are not scored. Results describe this outreach, not market-wide seller availability, verified intent to sell, or acquisition success.