First: What Is an SBIC, and Why Does It Matter?
A Small Business Investment Company (SBIC) is a privately owned and managed investment fund that's licensed and regulated by the SBA. What makes SBICs unique is their structure: they raise private capital from investors, then use SBA-guaranteed debentures to lever that capital (typically 2:1 or 3:1) and deploy it into small businesses as equity, debt, or some combination of both.
SBICs can invest in businesses in virtually any industry. They're one of the most active sources of lower-middle-market capital in the country, particularly for businesses that are too large for a traditional SBA 7(a) loan but not yet ready or not the right fit for a traditional private equity buyout.
The key insight: Every business that receives SBIC financing is a professionally vetted, institutionally capitalized company with a defined return timeline. That makes them highly predictable acquisition targets. Understanding where they're concentrated is a genuine edge for deal sourcing.
The Six-Year Picture: $44 Billion and Counting
From FY2020 through FY2025, SBIC funds deployed $44.1 billion across 17,211 individual financings to U.S. businesses. That's not a blip. It's a structural feature of the lower-middle-market capital landscape.
Here's how the annual totals break down:
| Fiscal Year | Total Financing | Number of Deals | YoY Change |
|---|---|---|---|
| FY2020 | $4.85B | 2,533 | Baseline |
| FY2021 | $7.05B | 2,491 | +45.4% |
| FY2022 | $7.82B | 3,097 | +10.9% |
| FY2023 | $8.00B | 3,375 | +2.3% (peak) |
| FY2024 | $7.23B | 2,625 | -9.6% |
| FY2025 | $7.16B | 2,590 | -1.0% |
The 2021 surge was driven by pandemic-era recovery: pent-up deal volume, expanded SBIC licensing, and businesses that had survived 2020 and needed growth capital to capitalize on the recovery. FY2023 marked the peak at $8.0B. The modest pullback in FY2024-25 reflects tighter credit conditions nationally, not a contraction of the SBIC program itself.
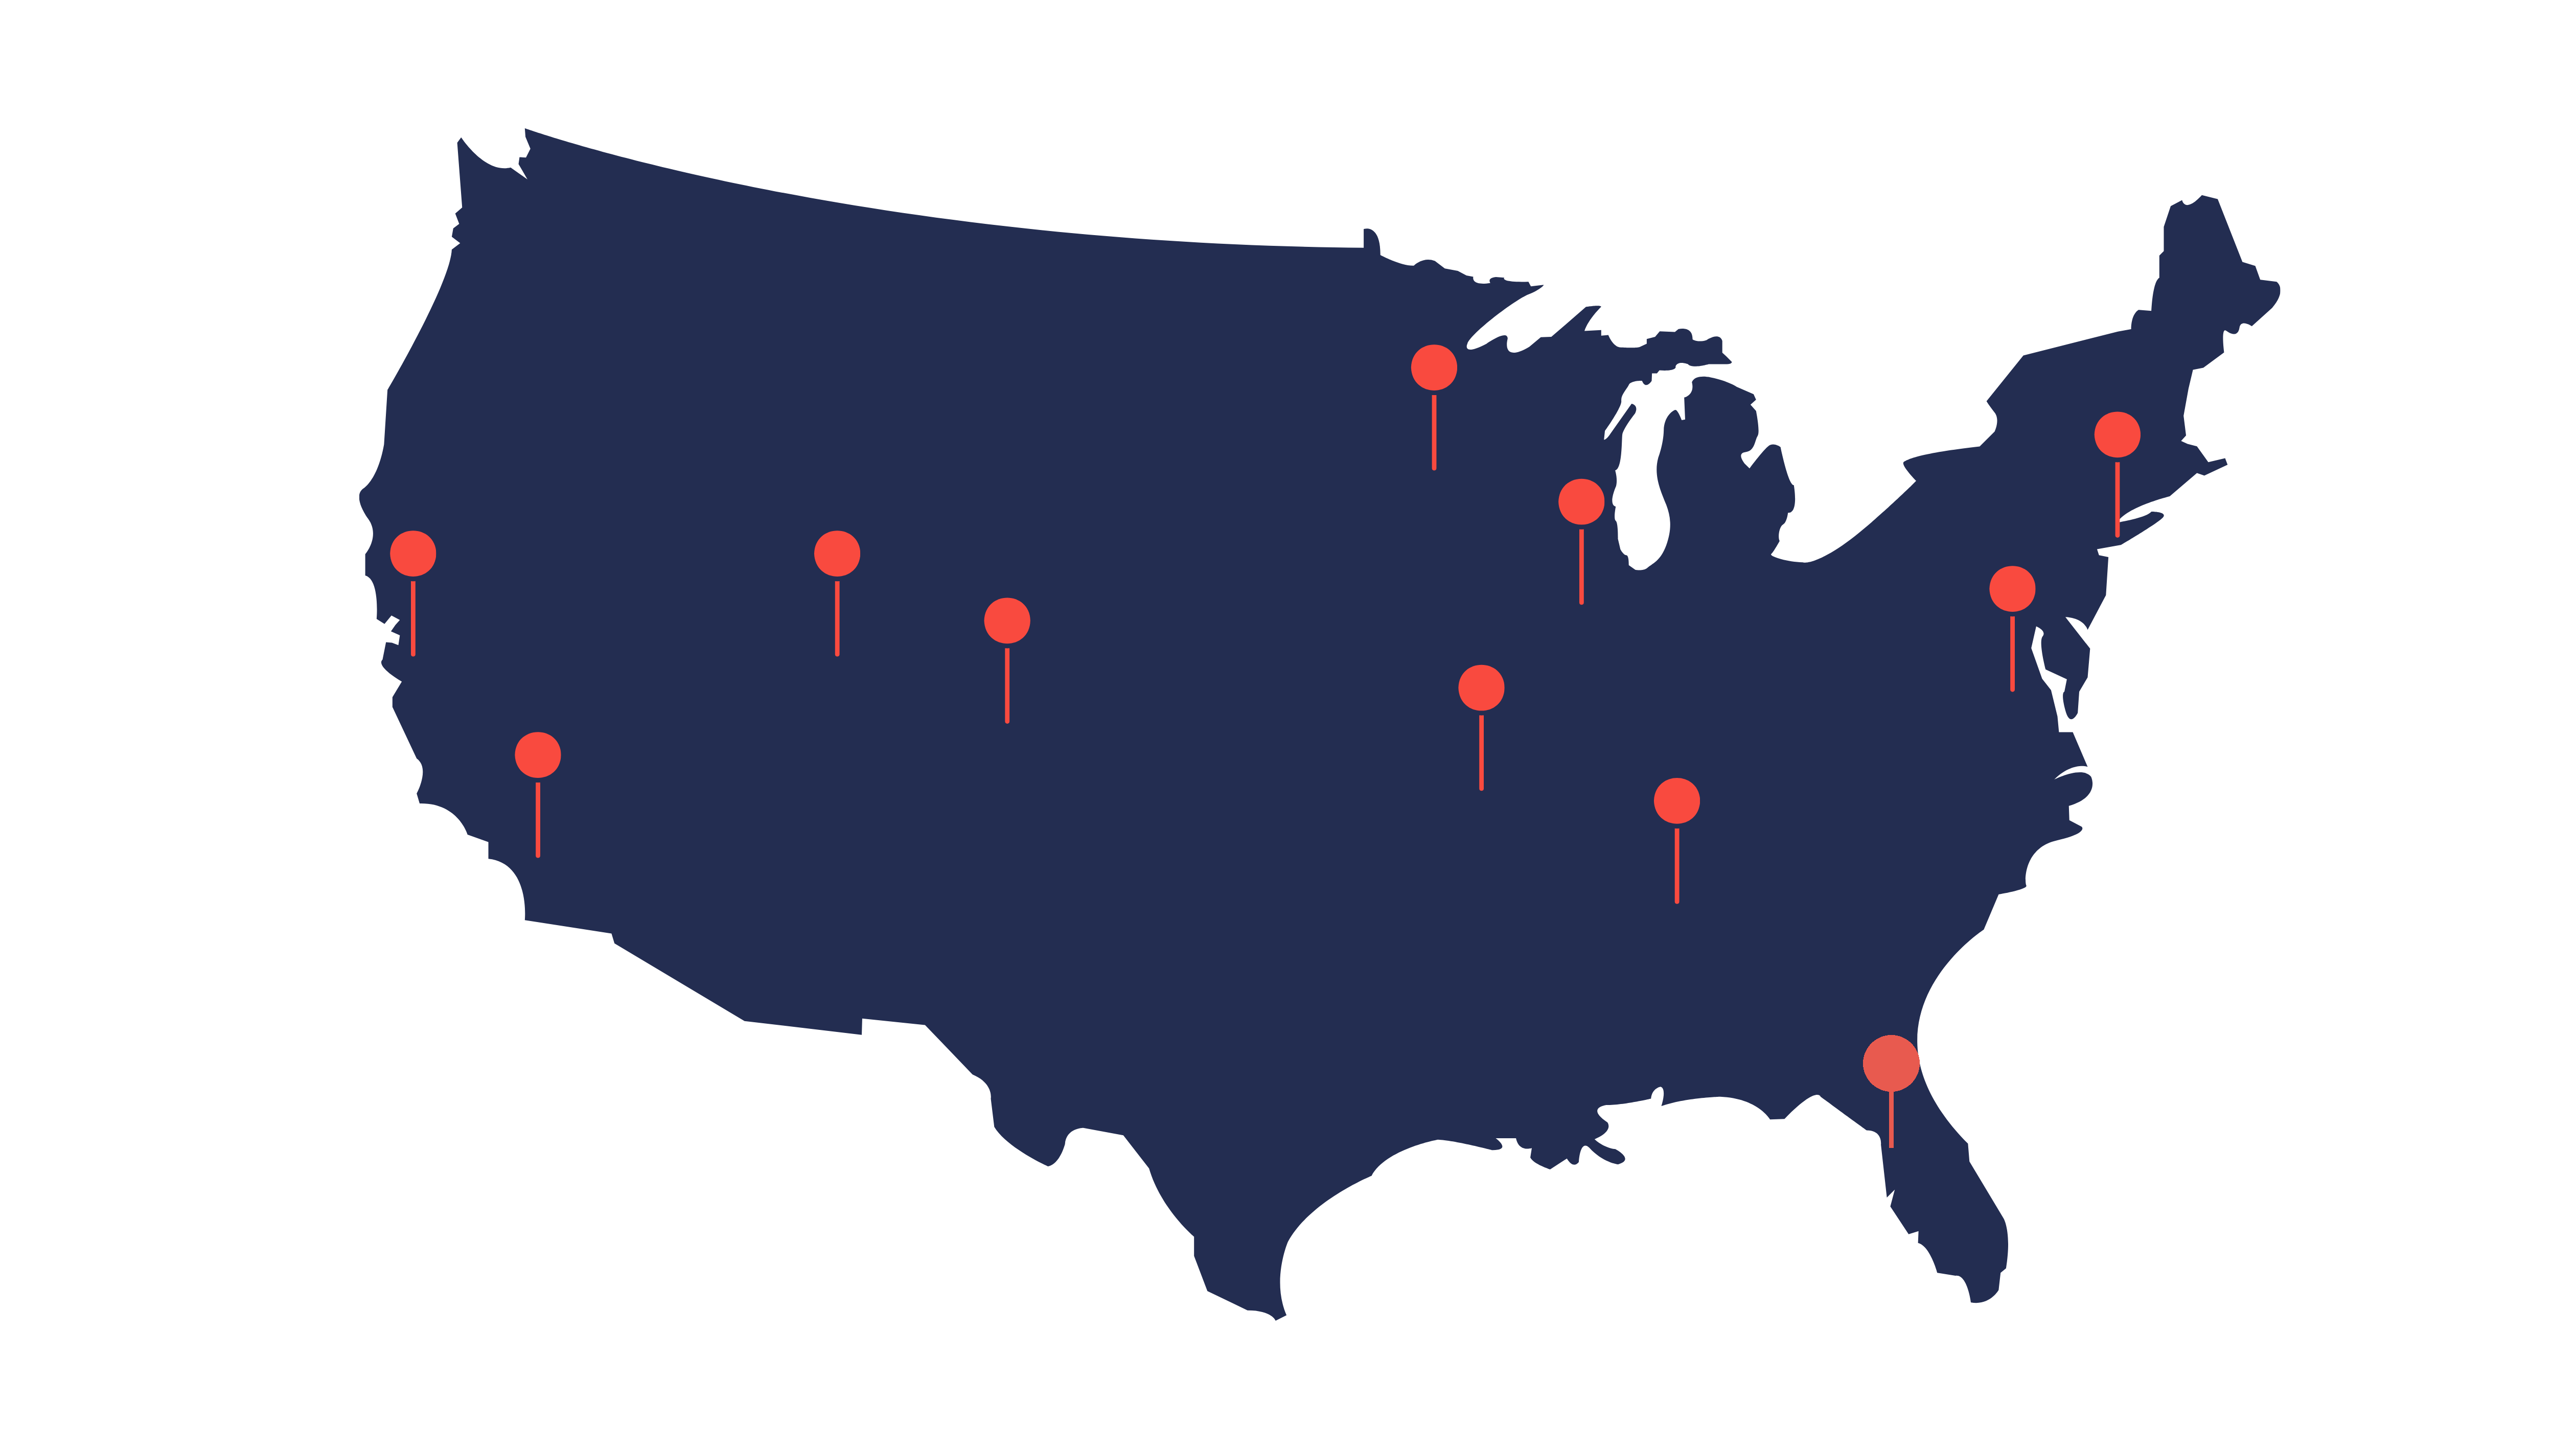
Where the Money Is Going: Top 10 States
Geography matters enormously in SBIC deployment. The top ten states by FY2025 financing tell a clear story: yes, coastal giants still dominate, but the Sunbelt is closing fast.
| Rank | State | FY25 Financing | FY25 Deals |
|---|---|---|---|
| #1 | California | $915.3M | 295 |
| #2 | Texas | $685.0M | 237 |
| #3 | Florida | $530.1M | 231 |
| #4 | Illinois | $479.9M | 188 |
| #5 | New York | $456.5M | 163 |
| #6 | North Carolina | $394.7M | 131 |
| #7 | Pennsylvania | $306.6M | 93 |
| #8 | Colorado | $294.9M | 108 |
| #9 | Massachusetts | $267.3M | 68 |
| #10 | Georgia | $188.7M | 68 |
California's $915M reflects both its sheer business density and the outsized presence of tech and life sciences, sectors that SBICs tend to finance heavily. But the more instructive number might be Texas at #2 with $685M across 237 deals. That's more deals than anywhere except California and Florida, and that deal count translates directly into a larger pool of potential acquisition targets.
The Sunbelt Surge: Where Growth Is Accelerating
Looking at raw FY2025 numbers is useful. But for deal sourcing, the more valuable signal is where capital has been accelerating. Accelerating investment means accelerating business formation, and business formation eventually leads to exits.
Here are the states with the most dramatic FY2020-to-FY2025 growth in SBIC financing:
- North Carolina: +168% ($147M to $395M). Charlotte has emerged as one of the most active lower-middle-market cities in the country. The Research Triangle continues to generate high-growth companies across life sciences, fintech, and advanced manufacturing.
- Texas: +109% ($328M to $685M). The $357M increase is the largest dollar-for-dollar growth of any state. Austin, Dallas, and Houston are all generating substantial deal flow independently.
- Washington: +118% ($29M to $63M). The Seattle tech ecosystem has expanded its SBIC footprint, and adjacent markets like Spokane and the eastern corridor are growing.
- Kentucky: +123% ($31M to $68M). Manufacturing reshoring and logistics buildout are driving business investment in a state that most deal professionals have historically underweighted.
- Oklahoma: +154% ($18M to $45M). Energy sector recovery plus agriculture-adjacent investment is accelerating in a market with limited competition for deals.
- Arkansas: +246% ($12M to $42M). The smallest absolute number on this list, but 246% growth from a small base is a leading indicator worth watching.
The pattern: Most of these states share two characteristics: lower cost of business formation than coastal markets, and meaningful infrastructure in at least one high-growth sector (tech, logistics, energy, life sciences). That combination is exactly what SBIC funds look for, and it's also what makes these businesses attractive acquisition targets.
How to Use This Data to Find Deals
Understanding SBIC financing flows gives you a map of where professionally managed, well-capitalized small businesses are concentrated. Here's how to put that to work:
1. Target high-density states for deal sourcing
If you're looking to source deals, start with the states at the top of the rankings. The sheer number of SBIC-backed businesses in California (295 deals in FY25 alone), Texas (237), and Florida (231) means there are more potential acquisition targets, and more brokers, investment bankers, and advisors actively working those markets.
2. Look at growth states for less competition
The fastest-growing markets (North Carolina, Colorado, Tennessee, Utah) are developing deal ecosystems that aren't yet as crowded as New York or California. Getting to know intermediaries in these markets before they're saturated is a meaningful competitive advantage.
3. Understand the SBIC timeline
SBICs typically have a 10-year fund life, and their investments are structured with defined return expectations. Businesses that received SBIC financing in FY2020 or FY2021 are now 4-5 years into a structure that may be approaching an exit window. That's a real and trackable event horizon for deal sourcing.
4. Think about structure, not just size
SBIC financings can be equity, subordinated debt, or a combination. A business that has SBIC subordinated debt may be looking to refinance or take on a new equity partner. That's a different conversation than a pure equity exit. Understanding the capital structure before you approach is what separates informed acquirers from everyone else.
The Bottom Line
$44 billion deployed into small businesses over six years isn't just a statistic. It's a record of where professional capital allocators have placed their bets on the American lower middle market. Those bets mature. They exit. They get acquired and seek new capital. Every one of those outcomes is a deal opportunity for buyers who know where to look.
The data is public. The geography is predictable. The edge goes to whoever maps it first and builds relationships in the right markets before the competition catches up.
Sources: SBA SBIC Financing by State Report, FY2020-2025 · SBA Office of Investment and Innovation